Studies Historical Map
Study · Published 15 November 2026 · Pre-registered · Descriptive
Ukraine and Russia in European news, 2021–2026
How news outlets in 40 European countries covered Ukraine, Russia and the war between them from January 2021 to October 2026: how much space the subject took, how closely the text stayed on it, and what it was about.
Explore the results · 1 of 3
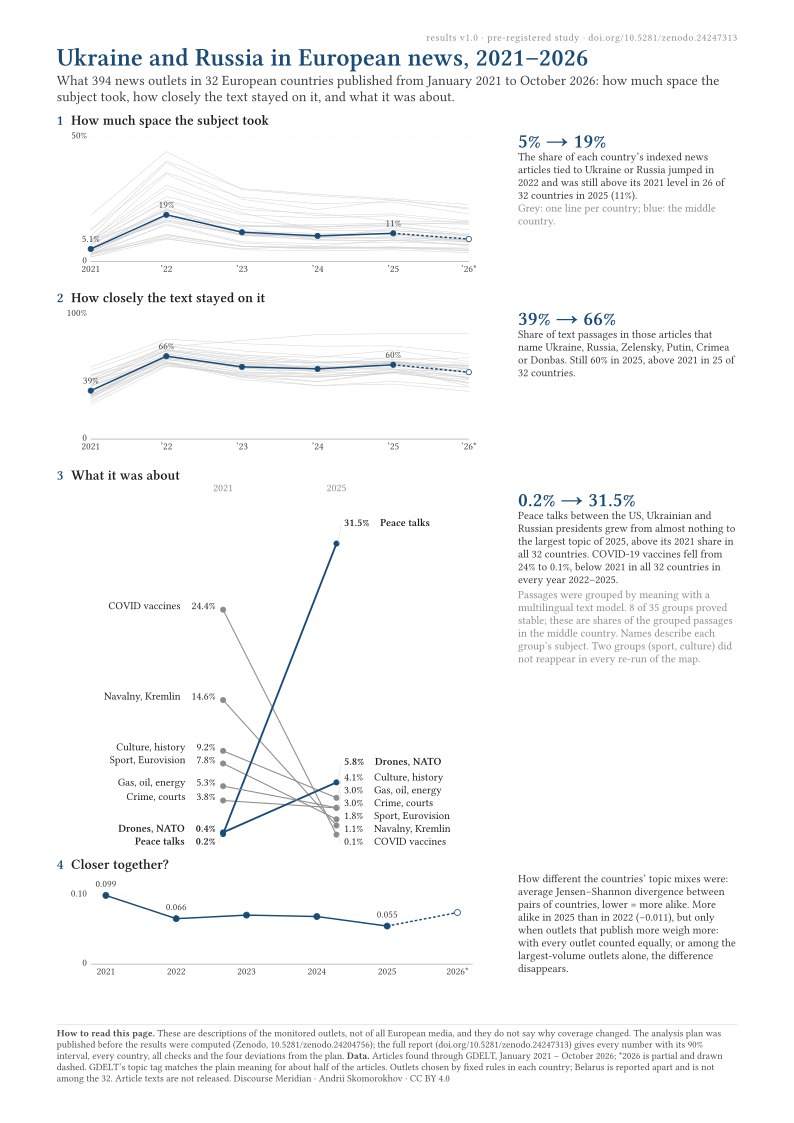
How much space the subject took
The share of each country's GDELT-indexed news articles tied to Ukraine or Russia, 2021–2026. Grey: one line per country. Orange: the median of the 32 countries.
Point at or tap a line for its value, its 90% interval and its reading against 2021. A country is above 2021 only when the two intervals do not overlap; a hollow dot is not distinguishable from 2021. *2026 covers January–October, is drawn dashed and is not compared with 2021. Belarus (‡) is reported apart and is not among the 32.
All values as a table
Percent; ↑ above 2021, · not distinguishable; 90% interval in brackets.
| Country | 2021 | 2022 | 2023 | 2024 | 2025 | 2026 (Jan–Oct) |
|---|---|---|---|---|---|---|
| Austria | 3.4 (2.5–4.5) | 14.6 ↑ (11.7–18.2) | 7.5 ↑ (5.4–10.3) | 6.1 · (4.4–8.2) | 5.7 · (4.4–7.2) | 5.5 (4.1–7.2) |
| Belgium | 4.5 (4.1–5.0) | 16.8 ↑ (15.6–24.1) | 10.8 ↑ (10.1–12.2) | 8.5 ↑ (7.3–9.7) | 8.5 ↑ (6.7–10.6) | 6.7 (4.5–9.6) |
| Bosnia and Herzegovina | 6.8 (5.8–7.7) | 20.8 ↑ (18.2–23.1) | 10.5 ↑ (9.0–12.5) | 8.8 · (7.6–10.4) | 10.1 ↑ (8.5–11.2) | 7.8 (6.5–9.1) |
| Bulgaria | 7.3 (4.5–10.4) | 20.3 ↑ (14.4–27.6) | 14.1 · (8.9–20.9) | 14.0 · (10.1–18.8) | 14.8 ↑ (11.5–19.3) | 15.6 (10.9–19.8) |
| Croatia | 4.4 (3.8–5.4) | 22.4 ↑ (18.7–25.3) | 11.5 ↑ (9.7–12.8) | 9.3 ↑ (7.8–10.8) | 13.5 ↑ (9.9–15.3) | 9.3 (8.0–10.1) |
| Czechia | 12.7 (11.2–14.6) | 35.7 ↑ (31.6–40.3) | 25.7 ↑ (22.7–29.4) | 23.2 ↑ (20.0–27.0) | 23.9 ↑ (20.7–27.9) | 19.0 (16.4–22.4) |
| Denmark | 2.6 (1.8–3.6) | 18.8 ↑ (13.0–22.9) | 11.4 ↑ (9.3–13.4) | 9.8 ↑ (8.0–11.3) | 11.4 ↑ (9.0–12.5) | 7.9 (7.0–8.9) |
| Estonia | 8.9 (5.7–12.6) | 30.5 ↑ (22.9–38.9) | 20.8 ↑ (13.1–27.6) | 19.3 ↑ (14.6–23.4) | 16.3 · (11.8–19.5) | 16.0 (9.8–19.8) |
| Finland | 3.7 (3.0–4.2) | 18.6 ↑ (14.6–23.2) | 12.1 ↑ (9.6–14.8) | 10.3 ↑ (8.5–12.2) | 10.9 ↑ (9.3–13.3) | 9.2 (7.9–10.7) |
| France | 3.4 (2.4–4.7) | 10.9 ↑ (8.5–14.0) | 6.2 · (4.7–8.1) | 5.7 · (4.3–7.5) | 5.8 · (4.6–7.1) | 4.4 (3.3–5.6) |
| Germany | 4.2 (3.5–5.0) | 18.0 ↑ (15.8–20.6) | 10.7 ↑ (9.4–12.3) | 9.8 ↑ (8.5–11.7) | 9.1 ↑ (7.5–11.2) | 7.8 (6.3–9.5) |
| Greece | 5.4 (4.8–6.0) | 21.3 ↑ (18.0–24.9) | 10.4 ↑ (8.2–12.8) | 10.3 ↑ (7.7–13.5) | 12.5 ↑ (9.2–16.9) | 10.4 (7.4–14.7) |
| Hungary | 7.8 (7.0–9.4) | 24.0 ↑ (20.1–29.8) | 14.7 ↑ (11.6–19.0) | 12.9 ↑ (9.7–18.0) | 14.2 ↑ (10.0–21.1) | 11.0 (7.8–17.4) |
| Ireland | 1.9 (1.1–2.5) | 10.4 ↑ (7.5–13.2) | 6.2 ↑ (4.6–7.8) | 5.4 ↑ (3.5–6.9) | 5.5 ↑ (3.6–6.9) | 5.0 (2.9–6.4) |
| Italy | 2.5 (2.2–3.0) | 15.1 ↑ (13.1–18.0) | 7.9 ↑ (6.8–9.2) | 7.2 ↑ (6.2–8.3) | 7.8 ↑ (6.6–9.2) | 6.9 (5.4–9.0) |
| Latvia | 12.6 (11.0–13.9) | 40.3 ↑ (36.1–42.0) | 29.2 ↑ (25.0–32.1) | 26.9 ↑ (22.4–30.6) | 25.1 ↑ (21.2–27.5) | 22.9 (19.1–26.2) |
| Lithuania | 18.5 (16.4–20.9) | 44.0 ↑ (39.8–48.5) | 28.9 ↑ (25.3–32.1) | 26.3 ↑ (23.8–28.7) | 24.6 ↑ (22.2–27.1) | 21.1 (18.8–23.3) |
| Luxembourg | 5.7 (4.6–5.9) | 15.9 ↑ (13.1–19.9) | 10.9 ↑ (10.4–11.9) | 9.9 ↑ (9.0–12.3) | 9.5 ↑ (8.3–12.4) | 8.7 (7.9–11.0) |
| Netherlands | 1.8 (1.1–2.8) | 9.0 ↑ (6.1–12.9) | 5.1 ↑ (3.4–7.0) | 6.2 ↑ (3.2–10.3) | 8.8 ↑ (3.9–13.3) | 6.3 (3.3–8.6) |
| North Macedonia | 6.7 (5.0–9.5) | 24.7 ↑ (18.5–31.3) | 16.0 ↑ (12.6–19.7) | 14.1 ↑ (11.0–17.7) | 14.4 ↑ (10.9–17.5) | 10.0 (7.0–12.5) |
| Norway | 7.8 (3.6–12.5) | 29.2 ↑ (20.6–35.8) | 19.6 · (11.6–27.6) | 12.4 · (9.4–15.2) | 12.4 · (10.0–14.2) | 10.8 (8.5–12.6) |
| Poland | 10.1 (7.9–12.4) | 39.6 ↑ (31.7–47.8) | 25.0 ↑ (18.9–30.3) | 20.8 ↑ (15.5–25.8) | 24.7 ↑ (18.0–30.5) | 21.5 (15.3–27.0) |
| Portugal | 5.0 (3.0–6.1) | 20.8 ↑ (15.5–23.4) | 13.5 ↑ (8.9–16.0) | 8.7 · (3.8–10.4) | 8.4 · (5.7–9.9) | 8.8 (4.0–10.5) |
| Romania | 8.1 (7.0–9.0) | 35.1 ↑ (32.3–38.5) | 22.1 ↑ (19.6–24.5) | 18.4 ↑ (15.7–21.0) | 19.1 ↑ (16.1–21.8) | 16.2 (13.6–18.8) |
| Serbia | 8.4 (7.3–9.6) | 18.7 ↑ (16.2–21.8) | 14.1 ↑ (11.5–16.6) | 14.8 ↑ (11.6–18.1) | 15.4 ↑ (12.4–18.5) | 15.0 (11.5–18.8) |
| Slovakia | 8.6 (7.7–9.1) | 26.0 ↑ (20.5–30.1) | 18.8 ↑ (15.1–21.6) | 17.5 ↑ (14.4–20.1) | 18.4 ↑ (15.3–22.5) | 15.0 (12.8–17.9) |
| Slovenia | 5.0 (2.4–7.1) | 16.3 ↑ (10.7–22.0) | 10.5 · (6.6–14.0) | 10.8 · (6.9–13.7) | 11.2 ↑ (7.6–14.0) | 8.5 (5.2–11.6) |
| Spain | 2.7 (2.3–3.3) | 9.7 ↑ (8.2–11.1) | 6.0 ↑ (5.1–6.9) | 5.0 ↑ (4.3–5.9) | 5.4 ↑ (4.6–6.1) | 4.3 (3.6–5.1) |
| Sweden | 3.8 (3.2–4.3) | 17.5 ↑ (13.4–21.9) | 14.4 ↑ (9.0–20.5) | 13.6 ↑ (9.8–16.6) | 15.6 ↑ (10.3–21.1) | 12.7 (8.8–15.3) |
| Switzerland | 5.1 (4.0–6.2) | 16.7 ↑ (15.0–18.6) | 12.3 ↑ (10.4–14.8) | 11.3 ↑ (9.3–13.6) | 10.7 ↑ (8.7–13.1) | 8.4 (6.4–10.8) |
| Türkiye | 3.3 (2.4–4.3) | 9.3 ↑ (7.3–11.6) | 4.7 · (3.8–5.6) | 4.3 · (3.6–4.9) | 4.7 · (4.0–5.4) | 3.6 (3.0–4.2) |
| United Kingdom | 3.1 (2.4–3.6) | 10.8 ↑ (9.5–12.4) | 6.1 ↑ (5.0–7.5) | 5.4 ↑ (4.3–6.8) | 5.9 ↑ (4.8–7.4) | 5.0 (3.8–6.3) |
| Belarus ‡ | 32.8 (26.0–45.8) | 39.1 · (32.6–58.8) | 19.6 · (14.3–41.3) | 16.6 · (9.5–40.4) | 14.2 · (7.9–37.5) | 23.0 (13.4–27.9) |
| Median of the 32 | 5.1 | 18.8 | 11.8 | 10.3 | 11.3 | 9.0 |
Data: q1-attention-primary.csv in the released tables archive (Zenodo), read by the site build and checked against the archive's SHA-256.
Explore the results · 2 of 3
How closely the text stayed on it
Among those articles, the share of text passages that name Ukraine, Russia, Zelensky, Putin, Crimea or Donbas, 2021–2026. Grey: one line per country. Orange: the median of the 32 countries.
Point at or tap a line for its value, its 90% interval and its reading against 2021. A country is above 2021 only when the two intervals do not overlap; a hollow dot is not distinguishable from 2021. *2026 covers January–October, is drawn dashed and is not compared with 2021. Belarus (‡) is reported apart and is not among the 32. † The word list was not validated for the country's language (deviation 1).
All values as a table
Percent; ↑ above 2021, · not distinguishable; 90% interval in brackets.
| Country | 2021 | 2022 | 2023 | 2024 | 2025 | 2026 (Jan–Oct) |
|---|---|---|---|---|---|---|
| Austria | 45.1 (40.4–50.0) | 70.9 ↑ (65.2–76.1) | 62.1 ↑ (53.1–69.2) | 56.0 · (48.8–61.8) | 61.7 ↑ (55.8–68.1) | 57.5 (49.9–63.6) |
| Belgium | 37.2 (25.9–45.6) | 61.9 ↑ (54.6–70.1) | 50.2 · (39.3–61.8) | 49.7 · (36.5–61.5) | 53.3 · (43.0–65.0) | 49.4 (38.9–64.8) |
| Bosnia and Herzegovina | 46.4 (40.2–54.7) | 70.4 ↑ (67.6–73.1) | 63.2 ↑ (59.2–68.1) | 61.3 ↑ (56.9–67.6) | 60.6 ↑ (56.3–67.6) | 58.3 (53.8–62.5) |
| Bulgaria | 38.6 (31.2–50.0) | 71.3 ↑ (67.8–76.1) | 64.0 ↑ (59.2–68.9) | 55.5 · (49.6–62.2) | 59.8 ↑ (53.8–65.4) | 59.3 (53.1–64.4) |
| Croatia | 43.5 (39.8–48.2) | 68.1 ↑ (64.8–71.2) | 60.3 ↑ (56.6–63.6) | 58.8 ↑ (55.1–62.5) | 62.3 ↑ (57.8–66.7) | 56.0 (49.5–61.8) |
| Czechia | 35.1 (30.1–41.6) | 67.3 ↑ (60.1–72.6) | 57.1 ↑ (50.1–63.0) | 57.9 ↑ (51.7–64.2) | 59.2 ↑ (54.1–64.6) | 53.4 (48.8–58.7) |
| Denmark | 55.1 (43.1–67.5) | 76.5 · (67.2–82.2) | 70.7 · (57.9–78.2) | 66.5 · (51.7–75.9) | 63.8 · (45.7–75.6) | 65.0 (52.3–73.0) |
| Estonia | 50.2 (36.0–57.5) | 73.8 ↑ (64.4–82.5) | 79.0 ↑ (59.9–85.5) | 83.8 ↑ (68.5–87.2) | 84.5 · (51.7–89.0) | 84.4 (43.4–89.9) |
| Finland | 51.4 (44.9–61.6) | 71.6 ↑ (66.1–78.3) | 67.0 ↑ (63.7–70.6) | 65.4 ↑ (61.7–68.9) | 71.3 ↑ (67.4–74.6) | 62.0 (54.0–69.0) |
| France | 34.7 (31.8–37.9) | 66.8 ↑ (63.6–69.1) | 57.1 ↑ (52.7–60.8) | 54.1 ↑ (50.1–58.5) | 61.4 ↑ (57.9–64.7) | 48.2 (44.4–53.0) |
| Germany | 34.9 (30.1–40.4) | 69.4 ↑ (64.5–75.1) | 61.0 ↑ (57.5–65.1) | 57.1 ↑ (52.2–62.4) | 58.7 ↑ (54.6–63.1) | 53.2 (49.0–57.8) |
| Greece | 35.6 (33.3–38.2) | 60.4 ↑ (58.5–62.3) | 49.9 ↑ (44.6–55.2) | 46.0 ↑ (41.5–51.9) | 53.7 ↑ (49.9–58.2) | 44.7 (40.4–49.3) |
| Hungary | 42.5 (39.6–45.7) | 65.5 ↑ (62.2–68.7) | 61.2 ↑ (57.9–64.4) | 61.5 ↑ (58.8–63.9) | 62.6 ↑ (59.3–66.1) | 52.6 (47.4–58.0) |
| Ireland | 33.7 (31.1–35.8) | 61.0 ↑ (55.5–64.6) | 47.6 ↑ (43.8–50.8) | 42.8 ↑ (37.9–46.3) | 46.3 ↑ (41.6–49.9) | 41.5 (37.8–45.8) |
| Italy | 29.4 (27.3–31.9) | 61.1 ↑ (57.4–64.5) | 54.0 ↑ (49.0–59.1) | 50.3 ↑ (45.1–55.3) | 55.6 ↑ (49.4–61.0) | 45.2 (39.5–49.8) |
| Latvia | 39.0 (33.0–43.9) | 64.9 ↑ (55.8–71.3) | 56.9 ↑ (51.8–61.6) | 57.7 ↑ (51.4–63.4) | 59.1 ↑ (51.7–65.8) | 59.0 (52.9–65.1) |
| Lithuania | 35.0 (30.9–40.2) | 64.2 ↑ (59.3–68.5) | 53.2 ↑ (48.3–57.9) | 52.9 ↑ (49.8–55.9) | 53.6 ↑ (50.1–57.3) | 51.7 (48.1–56.5) |
| Luxembourg | 43.0 (27.9–49.3) | 62.1 ↑ (58.5–69.3) | 51.4 · (46.2–56.0) | 46.1 · (35.5–56.0) | 54.2 · (46.0–59.0) | 55.8 (51.4–58.2) |
| Netherlands | 27.7 (18.9–50.5) | 58.3 · (49.4–65.9) | 52.8 · (43.5–59.9) | 52.1 · (41.1–62.9) | 62.2 ↑ (51.9–72.6) | 59.0 (46.5–74.1) |
| North Macedonia | 51.2 (46.1–55.6) | 64.7 ↑ (58.1–70.8) | 59.9 · (54.9–66.8) | 56.4 · (48.1–66.7) | 61.6 · (53.7–70.6) | 53.4 (45.5–62.7) |
| Norway | 35.9 (29.6–47.4) | 63.5 ↑ (56.3–74.7) | 58.3 ↑ (51.7–65.5) | 58.4 ↑ (52.2–64.5) | 56.0 ↑ (51.0–61.9) | 54.1 (45.9–61.5) |
| Poland | 37.6 (31.8–43.9) | 66.7 ↑ (62.8–70.4) | 56.4 ↑ (50.4–63.9) | 56.8 ↑ (50.4–63.2) | 61.0 ↑ (55.1–66.5) | 56.1 (51.7–60.2) |
| Portugal | 32.6 (28.8–38.5) | 68.1 ↑ (60.7–75.4) | 59.5 ↑ (54.4–63.9) | 54.0 ↑ (46.4–62.9) | 56.4 ↑ (47.5–66.7) | 42.4 (34.6–58.6) |
| Romania | 47.3 (43.0–50.9) | 74.9 ↑ (70.4–78.6) | 67.4 ↑ (61.2–72.7) | 62.1 ↑ (57.1–67.3) | 61.8 ↑ (57.2–66.1) | 53.7 (49.4–58.2) |
| Serbia | 42.2 (40.1–44.6) | 64.0 ↑ (60.0–68.0) | 55.3 ↑ (52.0–59.0) | 54.8 ↑ (50.7–59.1) | 57.8 ↑ (52.3–63.2) | 48.7 (42.5–54.3) |
| Slovakia | 57.7 (51.8–61.8) | 80.1 ↑ (75.2–83.5) | 76.4 ↑ (70.8–81.0) | 74.4 ↑ (69.9–79.3) | 74.7 ↑ (70.2–78.1) | 68.3 (61.6–74.4) |
| Slovenia | 32.9 (30.8–36.4) | 66.1 ↑ (62.2–69.5) | 57.4 ↑ (53.6–61.9) | 50.9 ↑ (47.9–55.1) | 55.8 ↑ (52.6–60.7) | 49.5 (46.8–52.9) |
| Spain † | 30.7 (27.8–34.4) | 61.1 ↑ (56.5–65.7) | 49.4 ↑ (44.5–54.1) | 42.9 ↑ (39.6–46.6) | 44.1 ↑ (41.0–47.4) | 38.2 (35.3–41.2) |
| Sweden | 48.4 (42.3–55.6) | 71.1 ↑ (66.6–74.9) | 65.0 · (54.7–71.0) | 59.8 · (47.5–68.6) | 65.7 · (47.2–77.4) | 60.4 (48.6–68.0) |
| Switzerland | 44.4 (39.0–49.6) | 74.2 ↑ (68.9–78.9) | 66.1 ↑ (62.2–69.5) | 61.3 ↑ (55.4–66.6) | 60.7 ↑ (54.0–67.3) | 56.7 (51.1–62.2) |
| Türkiye | 48.1 (44.6–51.3) | 59.7 ↑ (54.1–64.0) | 51.0 · (47.6–53.9) | 49.4 · (46.0–52.6) | 53.5 · (49.8–56.9) | 45.4 (41.5–48.9) |
| United Kingdom | 34.3 (30.8–38.8) | 58.8 ↑ (54.6–62.8) | 52.1 ↑ (48.7–55.3) | 49.7 ↑ (46.1–53.4) | 52.5 ↑ (48.3–56.9) | 47.6 (43.3–51.8) |
| Belarus † ‡ | 21.2 (17.8–25.4) | 13.4 · (11.7–27.3) | 25.2 · (16.1–49.6) | 36.7 · (20.4–61.6) | 37.2 · (23.6–65.6) | 33.3 (17.7–46.3) |
| Median of the 32 | 38.8 | 66.4 | 57.8 | 56.2 | 59.5 | 53.6 |
Data: q2-focus-primary.csv in the released tables archive (Zenodo), read by the site build and checked against the archive's SHA-256.
Explore the results · 3 of 3
What it was about
The share of each of the 8 stable topics among the grouped passages, in 2021 and in a later year. Orange: a topic with a larger share than in 2021. Grey: a smaller one.
Passages were grouped by meaning with a multilingual text model; 8 of the 35 groups proved stable, and only they carry statements. Names describe each group's subject. Sport and Culture did not reappear in every re-run of the map. For a country, a hollow dot or dashed line is a thin cell, which gets no reading.
Medians as a table
Median share of the 32 countries, percent (thin cells left out); ↑/↓ number of countries above/below 2021.
| Cluster | 2021 | 2022 | 2023 | 2024 | 2025 | 2026 |
|---|---|---|---|---|---|---|
| 0 COVID-19 vaccines, including Sputnik V | 24.4 | 0.7 ↓32 | 0.2 ↓32 | 0.2 ↓32 | 0.1 ↓32 | 1.1 |
| 4 Sport and the Eurovision Song Contest | 7.8 | 3.1 ↓15 | 2.6 ↓14 | 3.0 ↓15 | 1.8 ↓21 | 3.3 |
| 9 Crime, police, courts and spy cases | 3.8 | 1.6 ↓16 | 3.0 ↓2 | 3.2 ↓3 | 3.0 ↓2 | 4.1 |
| 16 Navalny, the Kremlin and the Russian opposition | 14.6 | 2.3 ↓32 | 3.2 ↓30 | 6.4 ↓23 | 1.1 ↓32 | 2.6 |
| 17 Culture, arts, history and personal stories | 9.2 | 4.2 ↓16 | 5.0 ↓8 | 4.8 ↓12 | 4.1 ↓15 | 5.0 |
| 19 Trump, Zelensky and Putin: peace talks | 0.2 | 2.0 ↑28 | 0.8 ↑19 | 3.9 ↑32 | 31.5 ↑32 | 9.4 |
| 20 Drones and aircraft in NATO airspace | 0.4 | 1.6 ↑20 | 1.4 ↑19 | 1.1 ↑17 | 5.8 ↑31 | 8.1 |
| 26 Gas, oil, energy prices and supplies, including Nord Stream | 5.3 | 13.6 ↑17 | 3.7 ↑1 ↓6 | 2.4 ↓9 | 3.0 ↑2 ↓9 | 5.8 |
Data: q3-composition-primary.csv and q3-cluster-names.csv in the released tables archive (Zenodo), read by the site build and checked against the archive's SHA-256.
What was measured
Every statement is about the monitored corpus: 411 selected outlets, 1.77 million articles and 6.1 million text passages. It is not a statement about European media as a whole, and it says nothing about why coverage changed.
33 of the 40 countries pass the coverage gate. The multi-country summaries use the 32 of them other than Belarus.
Four findings
-
Attention
The share of a country's GDELT-indexed articles that GDELT ties to Ukraine or Russia is above its 2021 level in all 32 countries in 2022 and in 26 of them in 2025 (cross-country median 5.1% in 2021, 18.8% in 2022, 11.3% in 2025).
Report, Sections 1 and 6
-
Focus
The share of passages of topic-relevant articles that name Ukraine, Russia, Zelensky, Putin, Crimea or Donbas is above 2021 in 30 of 32 countries in 2022 and in 25 in 2025 (median 38.8% in 2021, 66.4% in 2022, 59.5% in 2025).
Report, Sections 1 and 7
-
What it was about
The share of a cluster on peace talks between the US, Ukrainian and Russian presidents is above 2021 in all 32 countries in 2024 and 2025 (median 0.2% in 2021, 31.5% in 2025).
The share of a cluster on COVID-19 vaccines is below 2021 in all 32 countries in every year 2022–2025 (median 24.4% of clustered passages in 2021, 0.1% in 2025).
Report, Sections 1 and 8 · 8 of 35 topic clusters pass the pre-registered stability rule
-
Closer together?
The mean Jensen–Shannon divergence of topic composition between country pairs is lower in 2025 than in 2022 (paired difference −0.011, 90% interval −0.025 to −0.005). The difference is not distinguishable from 0 among the volume-rule outlets alone (check R9) or with every outlet weighted equally (check R4).
Report, Sections 1 and 8.3
How the method was applied
- Claim and measurement. Three pre-specified measures — attention, focus and topic composition — each with a definition, a denominator and a 90% interval from 1,000 seeded bootstrap draws.
- Reading rule. A cell is above or below 2021 only when the two intervals do not overlap; otherwise it is not distinguishable.
- Evidence and coverage. Per-cell count tables, outlet lists and a coverage gate are released; article texts are not, for copyright reasons.
- Validation. Four pre-registered checks of the lexicon, the reference annotator, the cluster names and GDELT's topic tag, reported whether they passed or not.
- Robustness and deviations. All eleven pre-registered checks, and four logged deviations from the plan, each with its date and what it affects.
How to read it
- These are descriptions of the monitored outlets, not of all European media, and they do not say why coverage changed.
- 2026 covers January–October; it is reported as a level and is never compared with 2021.
- Belarus is reported apart and is not among the 32 summary countries.
- The topic map is built by a multilingual text model; cluster names are for navigation, and only the 8 stable clusters carry statements.
Downloads and citation
- Report PDF · 24 pages
- Infographic PDF · 1 page
- Result tables ZIP · count-only, no article text
- Pre-registration Zenodo record
Cite as: Skomorokhov, A. (2026). Ukraine and Russia in European news, January 2021–October 2026: attention, focus and topic composition in 40 countries — results under the pre-registered analysis plan (version 1.0). Zenodo. https://doi.org/10.5281/zenodo.24247313
Licence: CC BY 4.0. The code and configuration are available from the author on request.